Cost Center File - FIL 24
Cost Center File Sales Analysis Screen
Cost Center File Adjusted Gross Profit Analysis Screen
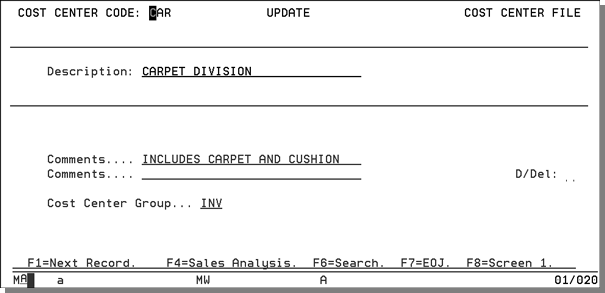
The Cost Center File defines the different aspects of a business for the purpose of analysis. Do not confuse the Cost Center File with the Branch File. The Branch File defines the physical locations or marketing regions of the business. A typical Cost Center File could include records for sales, warehouse, office, and administration. It could also include records for major product categories or divisions, such as wood or ceramic tile.
In general, a cost center defines a category of income or expenses. A cost center group is used only with general ledger spreadsheets. For instance, if you have different types of cost centers representing your inventory, you can group them together in a cost center group field called INV.
A cost center code can be assigned to some or all transactions and is used extensively in the accounts payable and general ledger modules. You can generate reports to help you analyze expenses and other financial information by cost center. Complete inventory and sales information is tracked for each cost center that represents a product category or division.

|
Field Name |
Description/Instructions |
|
Description |
Title or description of the cost center. |
|
Comments |
Enter notes concerning the use or definition of this cost center. |
|
Cost Center Group |
This field is optional. Enter a three-character code which groups or links cost centers together. For example, you could have 15 cost center codes broken into three groups such as sales related, inventory related and office related. Create three group codes such as SAL, INV and OFF and assign each of your 15 cost centers to one of the three group codes. The G/L Audit Report and spreadsheets can access cost centers specifically or by group. |
|
D/Del |
D in this field indicates that this record will be deleted. |
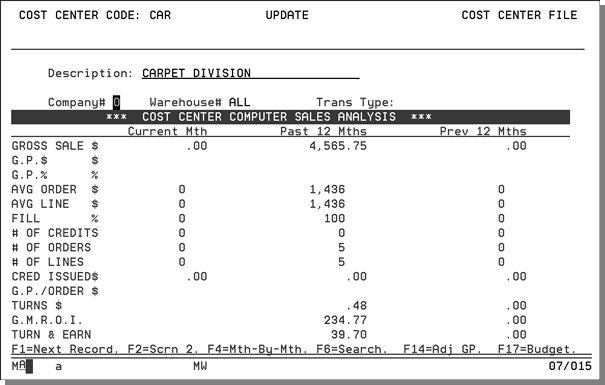
Cost Center File Sales Analysis Screen
Display the Cost Center File Sales Analysis Screen by pressing F4 on the Cost Center Profile Screen. Sales information appears only for cost centers that are used by sales and inventory systems. These cost centers are assigned to items in the Item File.

You can change the values in the company, warehouse, and transaction type fields to display different information.
The fields on this screen are described in the following table.
|
Field Name |
Description/Instructions |
|
Company # |
Enter a valid company number for which to display statistics. |
|
Warehouse |
Leave blank or enter ALL to see statistics for the entire company, combining all warehouses for that cost center. Enter a specific warehouse to limit statistics for that warehouse. Do not confuse warehouse with branch. The statistics relate to sales that used inventory from the specified warehouse. |
|
Trans Type |
Leave blank for all types of sales combined. |
Cost Center File Adjusted Gross Profit Analysis Screen
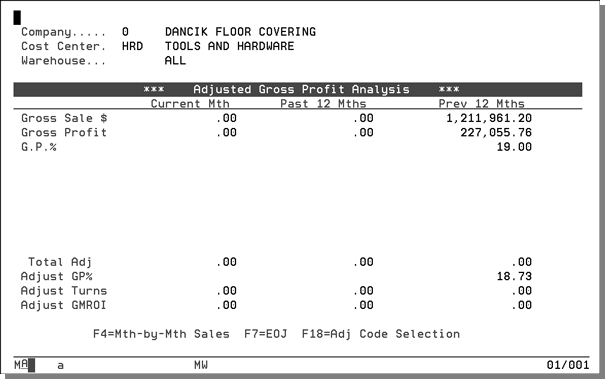
The Adjusted Gross Profit Analysis screen is accessed by pressing F14 on the Cost Center File Sales Analysis Screen or the Cost Center File Month-By-Month Sales Analysis screen. The Adjusted Gross Profit Analysis screen is another extension of the Sales Analysis screens. It is accessible in the Company, Warehouse, Cost Center, and Branch Files. It starts with the sales and gross profit figures from the Sales Analysis screen, and then adds the affect of inventory adjustments (by category), in order to display adjusted gross profit dollars, adjusted gross profit percentage, adjusted turns, and adjusted GMROI figures.

|
Field Name |
Description/Instructions |
|
Company# |
The previously selected company number. |
|
Cost Center |
The previously selected cost center, if you press F14 from the Cost Center File. If you are in the Company, Branch, or Warehouse Files,. this field is blank, indicating all cost centers combined. |
|
Warehouse |
The previously selected warehouse if you selected it from the Warehouse File. In other files, it displays blanks, indicating all warehouses combined, or it can display a previously selected warehouse. In the Branch File, this field is labeled Branch. All system modules distinguish branch from warehouse. Since these statistics concern inventory, they affect warehouse figures directly. Because branches are selling organizations and not necessarily inventory organizations, these inventory statistics might not relate directly to branches. However, to provide maximum benefit to all system users, we have used the following logic in designing these screens. In the Warehouse File, Adjusted Gross Profit figures are strictly related to that warehouse. In the Branch File, all sales figures relate to the branch, but the inventory adjustment figures relate to the warehouse, if any, with the same code as the branch. For example, if you are displaying statistics for the RAL branch, inventory statistics show for the RAL warehouse. If this warehouse does not exist, no inventory figures are shown. |
|
Current Month |
The current accounting month, based on the accounts receivable end-of-month close dates. |
|
Past 12 months |
The 12 months immediately preceding the current month. |
|
Previous 12 months |
The 12 months immediately preceding the past 12 months. |
|
Gross Sales |
The gross sales dollars for the category being displayed. |
|
Gross Profit$ |
The gross sales minus the cost of sales. |
|
Gross Profit % |
The gross profit dollar amount divided by gross sales. |
|
Cycle Count, Location, Measure-ment, Write Off, etc. |
The various categories of inventory adjustments. Each inventory adjustment is put into one of the available categories. The figures displayed for each adjustment category are their total affect on inventory value in the period displayed. A negative value indicates a loss of inventory (as for write offs), and a positive value indicates an inventory gain. You can enter X beside any adjustment category to view the details that comprise the totals shown. Each item number, description, quantity, and so on, can be viewed. Press F18 to display all available adjustment codes. The very first time the program is executed, all adjustment summary records are loaded. Once you press F18 and change the selection, and then press Enter to update, only your selections are displayed for that specific company, cost center, and warehouse combination |
|
Total Adj. |
Total dollar value of all adjustment categories. |
|
Adjust GP% |
Gross profit amount minus the total adjustments, divided by gross sales. This figure shows the gross profit percentage including the effect of inventory adjustments. GP% is lowered if total adjustments are a negative number, and vice versa. |
|
Adjust Turns |
Cost of sales plus total adjustments, divided by average inventory value. This figure shows the turns including the effect of inventory adjustments. When computing adjusted turns, if total adjustments is a negative number, cost of sales is increased by that number, which then reduces turns. |
|
Adjust GMROI |
This is the gross profit amount minus total adjustments, divided by average inventory value and multiplied by 100. This shows the GMROI including the effect of inventory adjustments. GMROI = Gross Margin Return on Inventory Investment. |
The following table describes the function keys on the Adjusted Gross Profit Screen.
|
Function Key |
Description |
|
F4 |
Go to the Cost Center File Sales Analysis screen. Press F4 again to display the Month-by-Month Sales Analysis screen. |
|
F6 |
Close the pop-up window and return to the previous screen. |
|
F7 |
Ends job and returns to the File Maintenance Menu. |
|
F18 |
Go to a list of all inventory adjustment codes and categories available on the system. From the list you can choose the adjustment types you want to include on the Adjusted Gross Profit display by typing an X next to your choices and pressing Enter twice. You can remove a category by removing the X and pressing Enter twice. For example, if you only want write-offs and damage to display on your Adjusted Gross Profit Analysis screen, press F18 to display a list of codes, and enter an X next to the W and D codes. Press Enter twice to activate your selection. Once selected, these choices remain in effect until you press F18 again. Press F18 to customize the categories displayed on the Adjusted Gross Profit display. |
Associated Files
Cost Center Reconciliation W/I AP Manifest Reconciliation
Validate Classification Codes & Cost Center in Item File
Chart of Accounts by Branch and Cost Center - ACT 8 and ACT 9
Branch/Cost Center Combination File (GLF 9)
